File:Dose-Response Curve.png
No higher resolution available.
Dose-Response_Curve.png (578 × 422 pixels, file size: 17 KB, MIME type: image/png)
Summary
| Description |
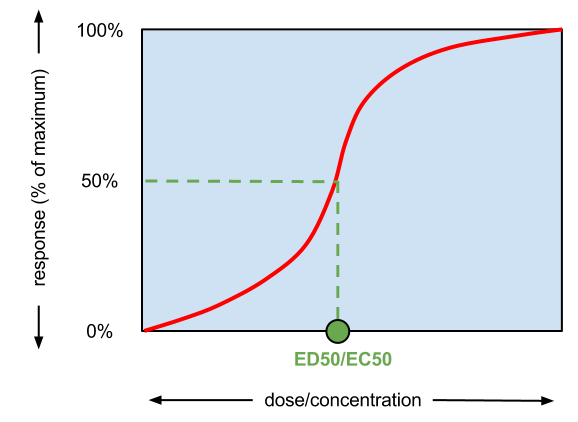
English: a simple graph depicting how the EC50 value for a receptor agonist is obtained
|
|---|---|
| Date | |
| Source | |
| Author | |
| Permission (Reusing this file) |
See below |
Licensing
|
File history
Click on a date/time to view the file as it appeared at that time.
| Date/Time | Thumbnail | Dimensions | User | Comment | |
|---|---|---|---|---|---|
| current | 13:25, 4 May 2012 | | 578 × 422 (17 KB) | Phlancelot (talk | contribs) |
You cannot overwrite this file.
File usage
There are no pages that use this file.